BUFFALO, N.Y. —
If the wind speed is higher than the temperature, you’re going to have a bad time. Think about it: an air temperature of 60 degrees and a wind speed 65 mph? No thanks!
Related: What makes the wind blow?
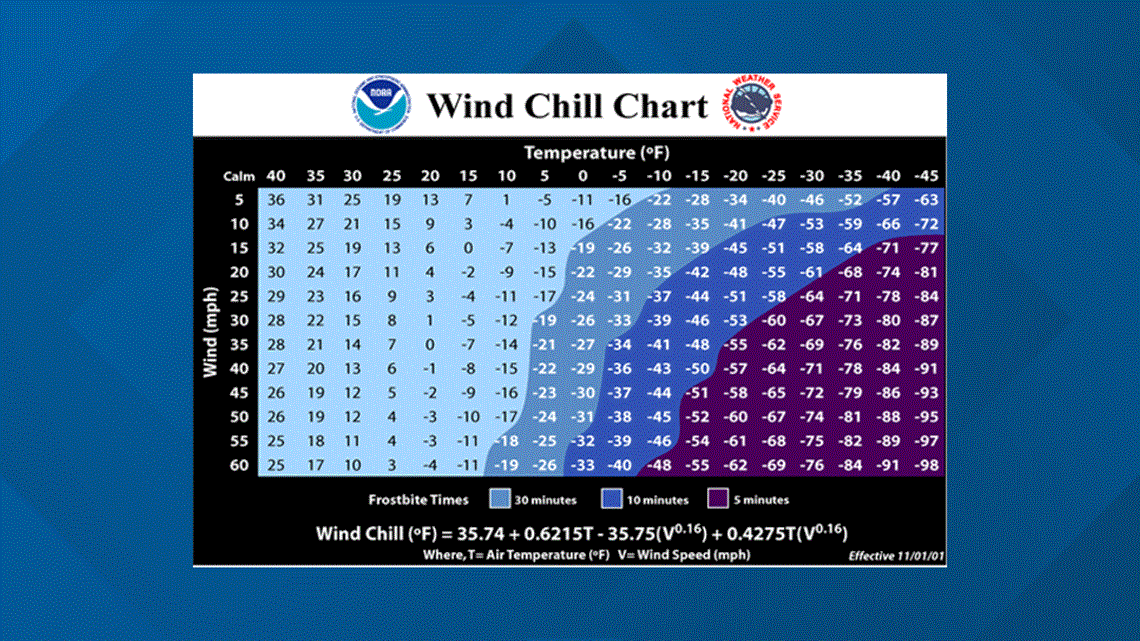
Those conditions of course are pretty rare around here, but a temperature of 20 degrees and a wind speed of 30 mph? You can see for yourself on the chart below that those conditions would give a wind chill of 1 degree Fahrenheit. That happens fairly often between now and March.


If there’s anything Buffalonians love to do with their winter suffering, it’s quantify that suffering (“We got 70” of snow five years ago!”). But where did the very specific numbers in the above chart come from?
Back in the 1940s, two researchers in Antarctica ran a very simple experiment. Paul Sipel and Charles Passel took two plastic containers and filled them with water, then suspended them from strings and timed how long it took the water to freeze. They observed that when winds were stronger, the water froze faster and concluded that wind must take heat energy away from objects faster.
They were right and the idea of wind chill was born. But wind chill values as we know them didn’t exist until about 20 years ago.


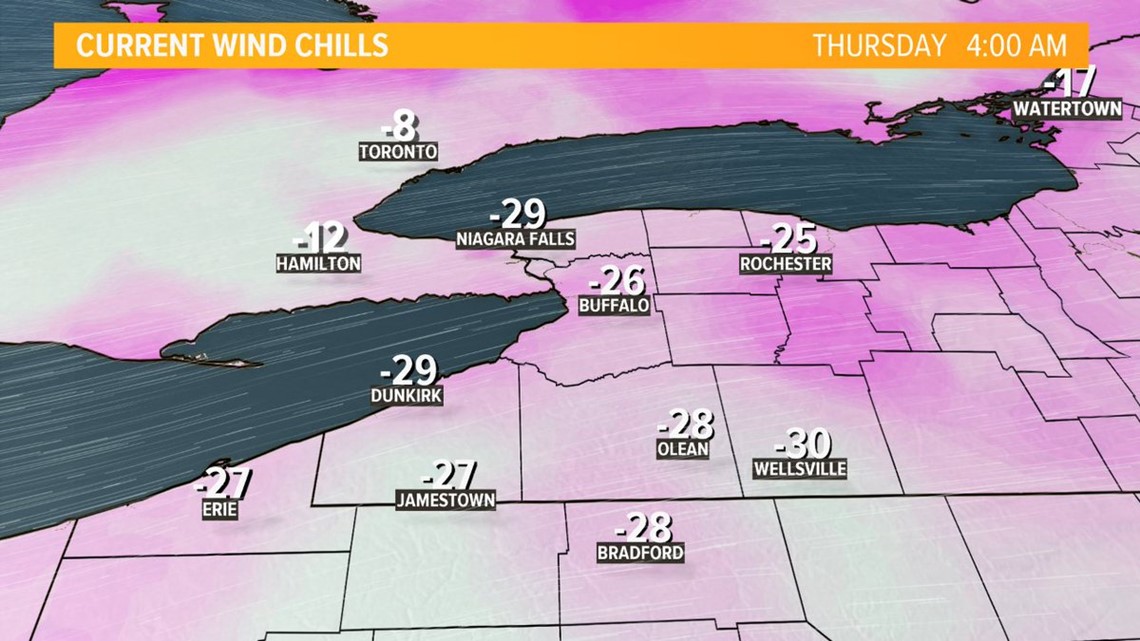
Originally, heat loss was expressed in watts per meter squared. But do YOU know what that means? Almost no one does. So in 2001, another group of scientists developed a new study. See how their odd methods led to wind chill temperature maps in this week’s video.
New episodes of Heather’s Weather Whys are posted to the WGRZ YouTube channel every Wednesday evening. You can also watch it on Thursdays at 5:30 on Channel 2 News. If you have a weather question for Heather to answer, send it to her at heather.waldman@wgrz.com or connect with her on Facebook or Twitter.


