BUFFALO, N.Y. — Earth’s rising global average temperature is the keystone to the climate change story. Temperatures are rising all over the globe at every point in the year, and some areas are seeing things change faster than others.
RELATED: Watch WGRZ’s Climate Minute
We’re seeing this here in Buffalo too. Just last week, NOAA released a brand new set of climate "normals" based on 30-year average data. The latest data set includes measurements taken between 1991 and 2020. The previous set covered 1981-2010. In that shift, Buffalo’s average annual temperature increased 0.6 degrees Fahrenheit.
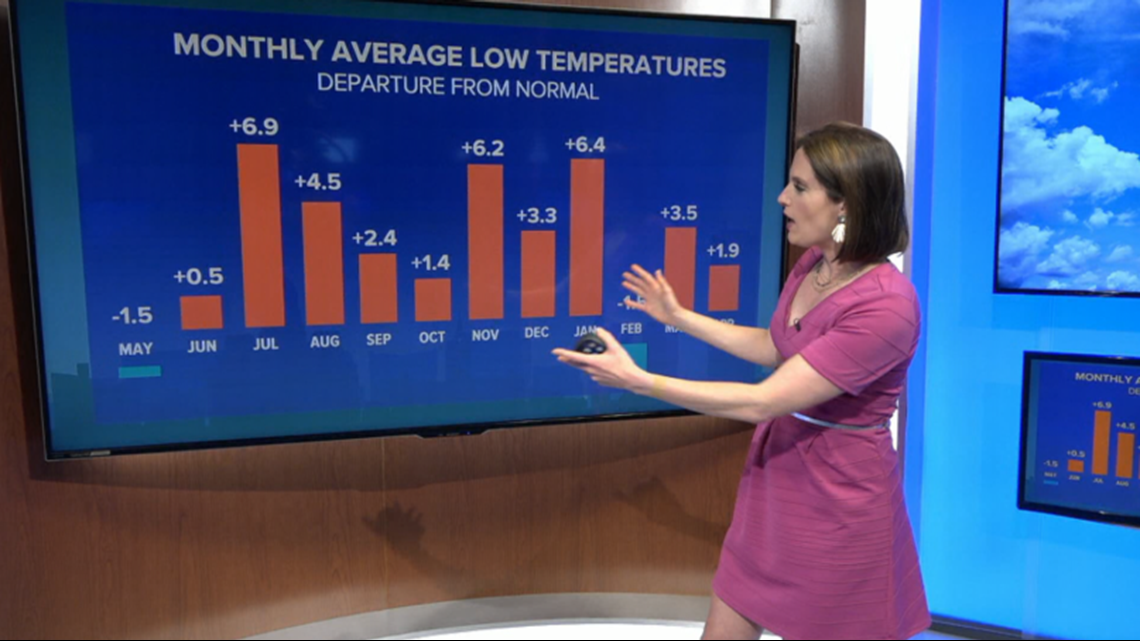
That probably seems negligible to you. But when the data gets broken down month by month and day part to day part, the differences are a little more stark. The chart below shows how much each monthly average low for the last 12 months differed from the respective 30-year normal. Many months in the winter were much milder than normal, but July really stands out from last summer.


Of course, July 2020 is now Buffalo’s hottest month on record and also boasts Buffalo’s longest heat wave on record. Half of the nights that month had overnight temperatures stay in the 70s.
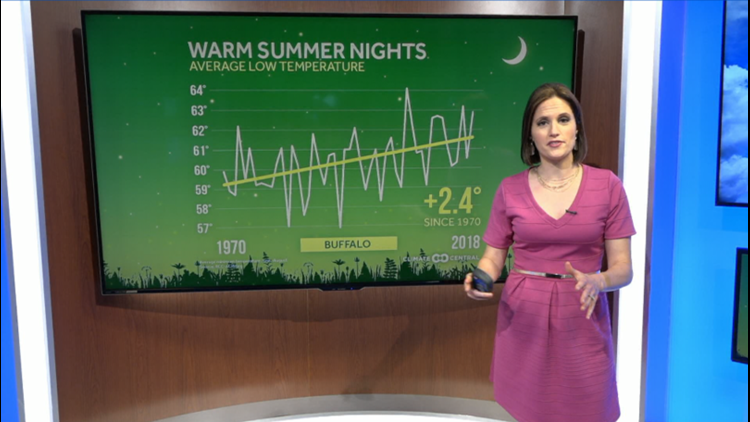
But it’s not just the hot, muggy nights that are getting warmer. The milder, more comfortable nights are too. That trend could negatively impact our health and the power grid. Watch this week’s Heather’s Weather Whys to see some of what that means.
New episodes of Heather’s Weather Whys are posted to the WGRZ YouTube channel every Wednesday evening.
If you have a weather question for me to answer, send it to heather.waldman@wgrz.com or connect with me on Facebook or Twitter.


