As the summer season slowly gives way to autumn, Buffalo's natural rain barrier set up by Lake Erie starts to lose its hold on day-to-day weather. During the warmer months, nearshore communities benefit from a "lake shadow." But as we coast through September and October, the average air temperature falls and the lake shadow gives way to more "lake effect."
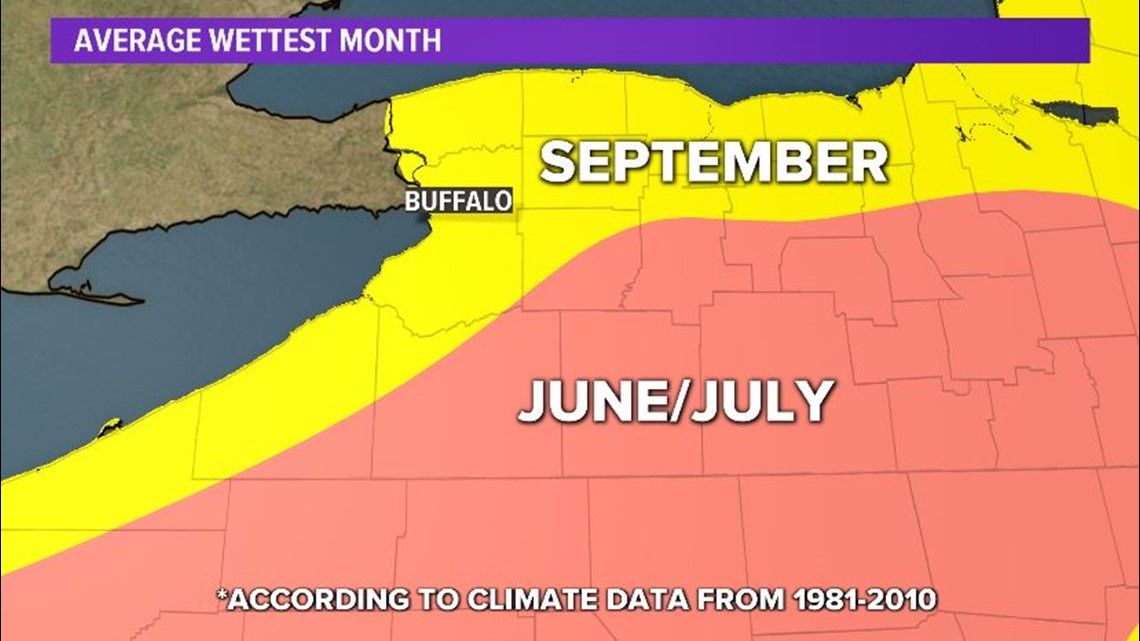
Lake Erie is a big driver of Western New York's weather, but it has a pretty big hold on the region's long-term climate as well. Data stretching 30 years — from 1981 to 2010 — shows that September is the city's wettest month on average.
Those same weather patterns are also the reason why the interior Southern Tier experiences its wettest month in June or July. While the lake shadow keeps the rain out of Buffalo, it makes it more likely to develop inland, where the lake has very little influence.


And no, the shift from the lake shadow to lake effect doesn't mean snow is right around the corner. We often see lake effect rain showers through fall and late spring. If you're still worried, Buffalo's earliest recorded measurable snowfall is October 6.
It's important to note that the month-to-month average temperature throughout the course of a year is pretty consistent for Buffalo. Most months average at least 3 inches so we really don't have a "wet" or a "dry" season. February is by far the driest month with 2.49 inches. At that point, Lake Erie tends to be frozen and its effects are taken out of the mix.
What's interesting is that average data from 2010 onward shows a small shift in when Buffalo experiences its wettest month. Recently, October and November have been slightly wetter, with September being a close third.
That is a relatively short-term trend but data from the same time span shows that our snow season may also be shifting slightly later in the year and lasting later into the spring. That may be partly because Lake Erie is staying warmer for longer periods of time. On average, the water temperature near Buffalo is 70 degrees or higher for about 75 days each year. That's up nearly 20 days per year compared to 50 years ago.
To learn more about other large scale signs of climate change, check out the Climate Minute online.
Related: Watch Climate Minute here


