BUFFALO, N.Y. — 2 On Your Side has analyzed the COVID-19 data released by the New York State Department of the Health on Sunday, November 8 for each individual county.
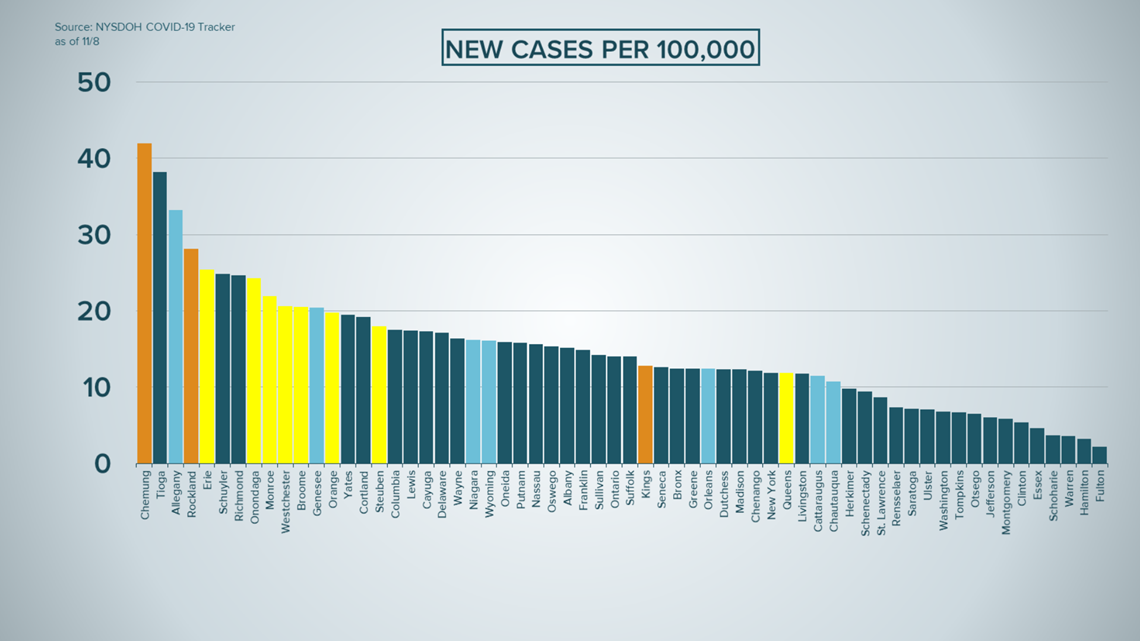
The graph detailed below shows each county's seven day rolling average of positive COVID-19 case per 100,000 residents.


All WNY counties (Erie, Niagara, Chautauqua, Cattaraugus and Allegany) are in the light blue, except Erie County, which is yellow, because it is now in a yellow zone.
Other counties throughout New York State that are in a yellow zone are also shaded the same, and counties with orange zones are shaded orange.
Allegany and Genesee Counties are not part of a state Precautionary or Warning Zone, but have similar numbers in cases per 100,000 other counties that are included in those zones.
- Allegany - 33 cases per 100,000 residents
- Erie - 25 cases per 100,000 residents
- Genesee - 20 cases per 100,000 residents
Niagara County announced Tuesday morning that it had 82 new cases on Monday. Daily reports from the other counties around the state have not been released yet, but Niagara County's increase will move it up this chart, likely falling around Westchester and Monroe.
- Monroe - 22 cases per 100,000 residents
- Westchester - 21 cases per 100,000 residents
- Niagara - 16 cases per 100,000 residents (as of Sunday)
You might notice that Kings and Queens Counties are low on the scale, but are either in a orange or yellow zone, respectively. That is because the state has identified specific micro-clusters inside the counties.
Below is a list of all the counties in New York State and what their 7 day rolling average of new cases per 100,000 residents (WNY region counties are in bold):
- Chemung - 42
- Tioga - 38
- Allegany - 33
- Rockland - 28
- Erie - 25
- Schuyler - 25
- Richmond - 25
- Onondaga - 24
- Monroe - 22
- Westchester - 21
- Broome - 20
- Genesee - 20
- Orange - 20
- Yates - 19
- Cortland - 19
- Steuben - 18
- Columbia - 18
- Lewis - 17
- Cayuga - 17
- Delaware - 17
- Wayne - 16
- Niagara - 16
- Wyoming - 16
- Oneida - 16
- Putnam - 16
- Nassau - 16
- Oswego - 15
- Albany - 15
- Franklin - 15
- Sullivan - 14
- Ontario - 14
- Suffolk - 14
- Kings - 13
- Seneca - 13
- Bronx - 12
- Greene - 12
- Orleans - 12
- Dutchess - 12
- Madison - 12
- Chenango - 12
- New York - 12
- Queens - 12
- Livingston - 12
- Cattaraugus - 11
- Chautauqua - 11
- Herkimer -10
- Schenectady - 9
- St. Lawrence - 9
- Rensselaer - 7
- Saratoga - 7
- Ulster - 7
- Washington - 7
- Tompkins - 7
- Otsego - 6
- Jefferson - 6
- Montgomery - 6
- Clinton - 5
- Essex - 5
- Schoharie - 4
- Warren - 4
- Hamilton - 3
- Fulton - 2
WATCH: What are Yellow Zones and what does it mean?


